
Data Lake vs Data Warehouse
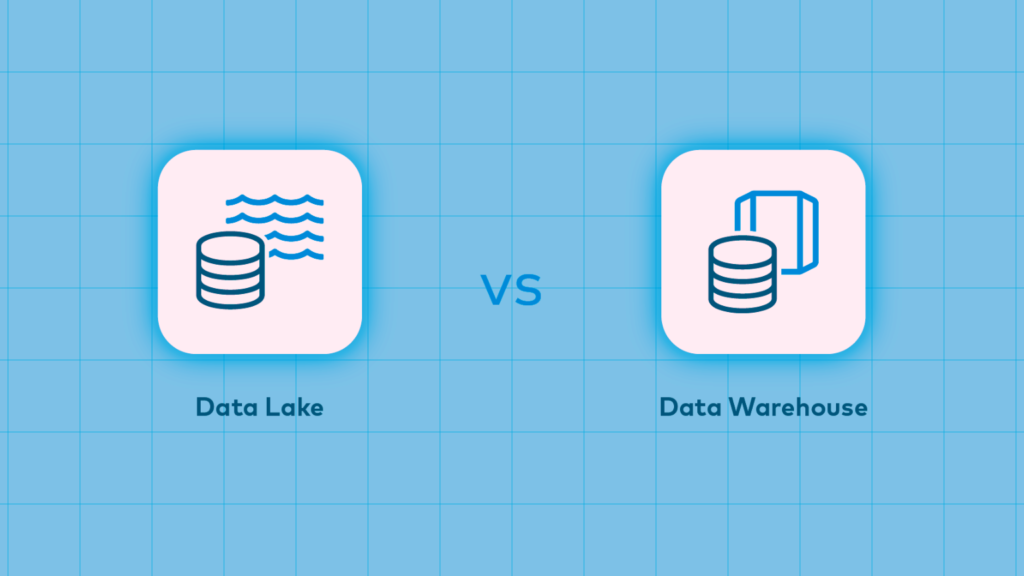
Data lake is a way to store big data that is unstructured but still valuable, such as social sentiment or advertising results. It can work with both a data warehouse and a database, but it requires careful management to avoid becoming a “data swamp.” On the other hand, a data warehouse is a more structured way to store data that has already been processed and is ready for analysis. It is typically used for business intelligence and reporting purposes. Understanding Data Lakes Data lake is a way to store big data that is unstructured but still valuable, such as social sentiment or advertising results. It is a repository that allows organizations to store all their structured and unstructured data at any scale. Data lakes enable organizations to store data in its raw format, without having to structure it beforehand, and then process it on an as-needed basis. However, it requires careful management to avoid becoming a “data swamp.” Power Your Analytics with the Best Business Intelligence Dataset What is Data Warehouses A data warehouse is a more structured way to store data that has already been processed and is ready for analysis. It is typically used for business intelligence and reporting purposes. Data warehouses are designed to support the efficient querying and analysis of data, and they often use a schema-on-write approach, which means that data is structured and organized before it is loaded into the warehouse. This makes it easier to analyze and report on the data, but it can also make it more difficult to work with unstructured data or data that doesn’t fit neatly into predefined categories. Key Differences Between Data Lake and Data Warehouse 1. Data Structure: Data lakes store raw, unstructured data, while data warehouses store structured, processed data. 2. Data Processing: Data lakes process data on an as-needed basis, while data warehouses process data before it is loaded into the warehouse. 3. Data Variety: Data lakes can store a wide variety of data types, including unstructured data, while data warehouses are typically limited to structured data. 4. Data Storage: Data lakes can store data at any scale, while data warehouses are typically limited in size and require careful management to avoid performance issues. 5. Data Use: Data lakes are often used for exploratory data analysis and machine learning, while data warehouses are typically used for business intelligence and reporting. Why a Data Lake and Not a Data Warehouse? a data lake may be a better choice than a data warehouse in certain situations. One reason is that data lakes can store a wider variety of data types, including unstructured data, which can be difficult to work with in a data warehouse. Additionally, data lakes can store data at any scale, making them a good choice for organizations that need to store large amounts of data. Data lakes also allow for more flexible data processing, as data can be processed on an as-needed basis, rather than being processed before it is loaded into the warehouse. That’s why it’s a cost effective solution. Finally, data lakes are often used for exploratory data analysis and machine learning, which may not be well-suited to a data warehouse environment. However, it’s important to note that data lakes require careful management to avoid becoming a “data swamp,” and they may not be the best choice for all organizations or use cases. Data Warehouse vs Data Mart: A Detailed Comparison References
Python Set vs List Understanding the Difference
In Python, both sets and lists are used to store collections of items. However, there are some key differences between the two that are important to understand. Lists are ordered collections of items, and can contain duplicates. They are mutable, meaning that you can add, remove, or modify items in the list. Lists are created using square brackets, and items are separated by commas. Sets, on the other hand, are unordered collections of unique items. They cannot contain duplicates, and are mutable. Sets are created using curly braces or the set() function, and items are separated by commas. One of the main benefits of using sets is that they can be used to perform set operations, such as union, intersection, and difference. Sets are also generally faster than lists for membership testing, since they use a hash table to store their items. When deciding whether to use a list or a set, it’s important to consider the specific needs of your program. If you need to maintain the order of your items, or if you need to store duplicates, a list may be the better choice. If you need to perform set operations or need to ensure that your items are unique, a set may be the better choice. Understanding Python Lists In Python, a list is an ordered and mutable collection of items that can contain items of different data types. Lists can be modified by adding, removing, or modifying items, and can be accessed using indexing and slicing. Python provides built-in functions for working with lists, including len(), min(), max(), and sum(). Lists are a versatile and powerful data structure in Python. Lists come with various built-in methods for manipulating and accessing the data they hold. Some of these include append() for adding items, remove() for removing items, sort() for sorting the list, and indexing like my_list[0] for accessing the first element. Power Your Analytics with the Best Business Intelligence Dataset Exploring Python Sets In Python, a set is an unordered and mutable collection of unique items. Sets are created using curly braces or the set() function, and items are separated by commas. Sets can be modified by adding or removing items, and can be used to perform set operations such as union, intersection, and difference. Sets are generally faster than lists for membership testing, since they use a hash table to store their items. When deciding whether to use a list or a set, it’s important to consider the specific needs of your program. Python Set vs List: Key Differences Uniqueness: Sets are collections of unique items, while lists can contain duplicate items. Order: Sets are unordered, meaning that the items in a set have no specific order, while lists are ordered, meaning that the items in a list are stored in a specific order. Mutability: Sets are mutable, meaning that you can add or remove items from a set after it has been created, while lists are also mutable. Membership testing: Sets are generally faster than lists for membership testing, since they use a hash table to store their items, while lists must be searched linearly. When to Use a List vs a Set You should use a list when you need to maintain the order of the items, and when you need to store duplicate items. Lists are also a good choice when you need to access items by their index, or when you need to modify the items in place. On the other hand, you should use a set when you need to ensure that the items are unique, and when you don’t need to maintain their order. Sets are also a good choice when you need to perform set operations such as union, intersection, and difference. In general, if you need to perform membership testing frequently, or if you need to remove duplicates from a collection of items, a set is likely to be a better choice than a list. If you need to maintain the order of the items, or if you need to access them by their index, a list is likely to be a better choice. Accelerate Your Career in AI with Best Machine Learning Courses References
Data Science vs Data Engineering: Understanding the Differences and Importance of Both
Data science and data engineering are two terms that are often used interchangeably, but they are actually two distinct fields that work together to create value from data. In this article, we will explore the differences between data science vs data engineering and why both are important for any organization that wants to leverage data to drive business value. What is Data Science? Data science is the field of study that involves using statistical and computational methods to extract insights and knowledge from data. Data scientists are responsible for analyzing data, building predictive models, and communicating insights to stakeholders. They use a variety of tools and techniques, including machine learning, data visualization, and statistical analysis, to make sense of large and complex datasets. What is Data Engineering? Data engineering, on the other hand, is the field of study that involves designing, building, and maintaining the infrastructure that enables data analysis. Data engineers are responsible for creating data pipelines, which are the systems that move data from its source to its destination. They also design and maintain databases, data warehouses, and other data storage systems. The Role of Data Science vs Data Engineering in Creating Value from Data While data science and data engineering are two distinct fields, they are both essential for creating value from data. Data science is responsible for analyzing data and extracting insights, while data engineering is responsible for creating the infrastructure that enables data analysis. Without data engineering, data scientists would not have access to the data they need to perform their analyses. Data engineering is responsible for creating the data pipelines that move data from its source to its destination, and for ensuring that the data is clean, accurate, and up-to-date. On the other hand, without data science, data engineering would not be able to create value from the data. Data science is responsible for analyzing the data and extracting insights that can be used to drive business value. Data scientists use machine learning, data visualization, and statistical analysis to identify patterns and trends in the data, and to make predictions about future outcomes. Best Linux Distro For Programming: Unraveling the Choices The Skills Required for Data Science vs Data Engineering Data science and data engineering require different skills and expertise. Data scientists need to have a strong background in statistics, mathematics, and computer science. They also need to be proficient in programming languages such as Python, R, and SQL, and in tools such as Jupyter Notebook, Tableau, and TensorFlow. Data engineers, on the other hand, need to have a strong background in computer science and software engineering. They need to be proficient in programming languages such as Java, Python, and SQL, and in tools such as Hadoop, Spark, and Kafka. They also need to have a deep understanding of data storage systems, such as databases and data warehouses, and of data integration and ETL (extract, transform, load) processes. The Importance of Collaboration between Data Science and Data Engineering While data science and data engineering require different skills and expertise, they are both essential for creating value from data. Collaboration between data scientists and data engineers is therefore crucial for any organization that wants to leverage data to drive business value. Data scientists and data engineers need to work together to ensure that the data is clean, accurate, and up-to-date, and that the data pipelines are efficient and reliable. They also need to work together to ensure that the data is stored in a way that is optimized for analysis, and that the data analysis tools are integrated with the data storage systems. The Future of Data Science and Data Engineering Data science and data engineering are both rapidly evolving fields, and the future looks bright for both. As more and more organizations recognize the value of data, the demand for data scientists and data engineers is likely to continue to grow. In the future, we can expect to see more automation in both data science and data engineering. Machine learning algorithms will be used to automate many of the tasks that are currently performed by data scientists, such as data cleaning and feature engineering. Similarly, data engineering tasks such as data integration and ETL will be increasingly automated using tools such as Apache NiFi and Apache Airflow. Power Your Analytics with the Best Business Intelligence Dataset Conclusion Data science and data engineering are two distinct fields that work together to create value from data. Data science is responsible for analyzing data and extracting insights, while data engineering is responsible for creating the infrastructure that enables data analysis. Collaboration between data scientists and data engineers is crucial for any organization that wants to leverage data to drive business value. As the demand for data scientists and data engineers continues to grow, we can expect to see more automation in both fields, making it easier and more efficient to create value from data.
Tableau vs Power BI: Which Business Intelligence Tool is Right for You?
Business Intelligence (BI) tools are essential for organizations that want to make data-driven decisions. Two of the most popular BI tools on the market today are Tableau and Power BI. In this article, we will compare Tableau vs Power BI and help you decide which one is right for your organization. What is Tableau? Tableau is a data visualization tool that allows users to create interactive dashboards and reports. It is known for its ease of use and intuitive drag-and-drop interface. Tableau can connect to a wide range of data sources, including spreadsheets, databases, and cloud services. It also has a large community of users who share tips and best practices. What is Power BI? Power BI is a cloud-based business analytics service that allows users to create interactive visualizations and reports. It is part of the Microsoft Power Platform and integrates with other Microsoft products such as Excel and SharePoint. Power BI can connect to a wide range of data sources, including cloud services, databases, and big data sources. Tableau vs Power BI Data Visualization One of the most important features of any BI tool is its ability to create compelling visualizations. Tableau and Power BI both excel in this area, but they have different approaches. Tableau is known for its beautiful and interactive visualizations. It has a wide range of chart types and customization options, allowing users to create stunning dashboards and reports. Tableau also has a large community of users who share their visualizations and best practices. Power BI, on the other hand, is known for its simplicity and ease of use. It has a more limited range of chart types, but it makes up for this with its intuitive drag-and-drop interface. Power BI also has a large library of pre-built visualizations that users can customize to their needs. Data Sources Another important consideration when choosing a BI tool is its ability to connect to different data sources. Tableau and Power BI both have strong capabilities in this area. Tableau can connect to a wide range of data sources, including spreadsheets, databases, and cloud services. It also has a large community of users who have created connectors for other data sources. Power BI can also connect to a wide range of data sources, including cloud services, databases, and big data sources. It has a strong integration with other Microsoft products, such as Excel and SharePoint. Ease of Use Ease of use is another important consideration when choosing a BI tool. Tableau and Power BI both have intuitive interfaces, but they have different approaches. Tableau is known for its ease of use and intuitive drag-and-drop interface. It has a simple and straightforward workflow that allows users to create visualizations quickly and easily. Tableau also has a large community of users who share tips and best practices, making it easy for new users to get started. Power BI is also known for its ease of use, but it has a more structured workflow. It has a step-by-step process for creating visualizations, which can be helpful for users who are new to BI tools. Power BI also has a large library of pre-built visualizations that users can customize to their needs. Pricing Pricing is always an important consideration when choosing a BI tool. Tableau and Power BI have different pricing models. Tableau offers both a desktop and a server version of its software. The desktop version starts at $70 per user per month, while the server version starts at $35 per user per month. Power BI, on the other hand, is a cloud-based service that is priced on a per-user basis. It has a free version that allows users to create and share visualizations, but it has limited data storage and sharing capabilities. The paid version starts at $10 per user per month and includes more advanced features such as data modeling and collaboration. Power Your Analytics with the Best Business Intelligence Dataset Which BI Tool is Right for You? Choosing the right BI tool depends on your organization’s needs and budget. If you are looking for a tool with a wide range of visualization options and a large community of users, Tableau may be the right choice for you. If you are looking for a tool that is easy to use and integrates well with other Microsoft products, Power BI may be the right choice for you. Ultimately, the best way to decide which BI tool is right for you is to try them both out. Both Tableau and Power BI offer free trials, so you can test them out and see which one works best for your organization. Conclusion Tableau and Power BI are both powerful BI tools that can help organizations make data-driven decisions. They have different strengths and weaknesses, so it is important to choose the one that best fits your organization’s needs and budget. By considering factors such as data visualization, data sources, ease of use, and pricing, you can make an informed decision and choose the BI tool that is right for you. Accelerate Your Career in AI with Best Machine Learning Courses
How AI Is Improving Data Management

Data management is a critical aspect of modern business operations. With the increasing volume and complexity of data, organizations are looking for ways to improve their data management processes. One of the most promising solutions is the use of artificial intelligence (AI) methodologies. In this article, we will explore how AI is improving data management and the benefits it offers. Data Management Data management is the process of collecting, storing, organizing, and maintaining data. It involves a range of activities, including data entry, data processing, data analysis, and data visualization. Effective data management is essential for organizations to make informed decisions, improve operational efficiency, and gain a competitive advantage. However, traditional data management approaches are often time-consuming, error-prone, and limited in their ability to handle large volumes of data. This is where AI comes in. AI methodologies can help organizations automate data management processes, reduce errors, and gain insights from large datasets. Accelerate Your Career in AI with Best Machine Learning Courses Challenges in Data Management Before we dive into how AI is improving data management, let’s first look at some of the challenges organizations face in managing their data. Finally, data management is often a manual process that is prone to errors. Data entry errors, for example, can lead to inaccurate data that can have serious consequences for decision-making. How AI is Improving Data Management ? AI methodologies are transforming data management by automating processes, reducing errors, and providing insights from large datasets. Here are some of the ways AI is improving data management: Data Integration One of the key benefits of AI in data management is its ability to integrate data from different sources. AI algorithms can analyze data from various sources, including structured and unstructured data, and integrate them into a single dataset. This makes it easier for organizations to analyze data and gain insights. Data Cleansing Data cleansing is the process of identifying and correcting errors in data. AI algorithms can automate this process by identifying errors and inconsistencies in data and correcting them automatically. This reduces the risk of errors and ensures that data is accurate and reliable. Predictive Analytics AI algorithms can analyze large datasets and identify patterns and trends that are difficult to detect using traditional methods. This is known as predictive analytics. By analyzing historical data, AI algorithms can predict future trends and outcomes, enabling organizations to make informed decisions. Natural Language Processing Natural language processing (NLP) is a branch of AI that deals with the interaction between computers and human language. NLP algorithms can analyze unstructured data, such as emails and social media posts, and extract valuable insights. This can help organizations understand customer sentiment, identify emerging trends, and improve customer service. Machine Learning Machine learning is a subset of AI that involves training algorithms to learn from data. Machine learning algorithms can analyze large datasets and identify patterns and trends that are not immediately apparent. This can help organizations make more accurate predictions and improve decision-making. Power Your Analytics with the Best Business Intelligence Dataset Real-World Examples AI is already being used in a range of industries to improve data management. Here are some real-world examples: Healthcare AI is being used in healthcare to improve patient outcomes and reduce costs. For example, AI algorithms can analyze patient data to identify patterns and predict which patients are at risk of developing certain conditions. This can help healthcare providers intervene early and prevent costly hospitalizations. Finance AI is being used in finance to improve fraud detection and risk management. For example, AI algorithms can analyze financial transactions and identify patterns that indicate fraudulent activity. This can help financial institutions prevent fraud and reduce losses. Retail AI is being used in retail to improve customer experience and increase sales. For example, AI algorithms can analyze customer data to identify buying patterns and make personalized product recommendations. This can help retailers improve customer satisfaction and increase sales. Conclusion AI is transforming data management by automating processes, reducing errors, and providing insights from large datasets. By integrating AI methodologies into their data management processes, organizations can improve decision-making, reduce costs, and gain a competitive advantage. As AI continues to evolve, we can expect to see even more innovative solutions for data management in the future. References
K-fold Cross Validation vs Leave one out
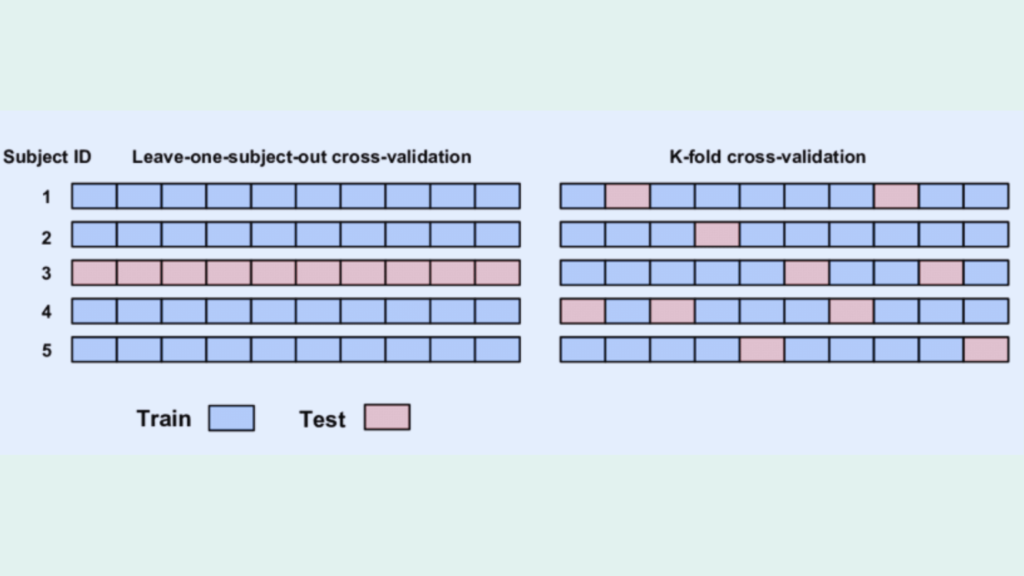
Cross-validation is a widely used technique in machine learning and data science to evaluate the performance of predictive models. It involves partitioning a dataset into training and validation sets and then using the validation set to estimate the model’s prediction error. One of the most common types of cross-validation is k-fold cross-validation, which involves dividing the data into k subsets and using each subset as a validation set in turn. Another popular method is leave-one-out cross-validation, where each observation is used as a validation set once, and the remaining data is used for training. In this article, we will explore the differences between k-fold cross validation vs leave one out cross-validation and when to use each method. K-fold Cross-validation K-fold cross-validation is a popular method for estimating the prediction error of a model. It involves dividing the data into k subsets, or folds, of approximately equal size. The model is then trained on k-1 folds and tested on the remaining fold. This process is repeated k times, with each fold serving as the validation set once. The results are then averaged to obtain an estimate of the model’s prediction error. One of the advantages of k-fold cross-validation is that it provides a more accurate estimate of the prediction error than other methods, such as holdout validation, which involves randomly dividing the data into training and validation sets. K-fold cross-validation also allows for a more efficient use of data, as each observation is used for both training and validation. However, k-fold cross-validation can be computationally expensive, especially for large datasets or complex models. The choice of k can also affect the estimate of the prediction error, with larger values of k resulting in a lower bias but higher variance. Leave-One-Out Cross-Validation Leave-one-out cross-validation is a special case of k-fold cross-validation, where k is equal to the number of observations in the dataset. In this method, each observation is used as a validation set once, and the remaining data is used for training. This process is repeated n times, where n is the number of observations in the dataset. One of the advantages of leave-one-out cross-validation is that it provides an unbiased estimate of the prediction error, as each observation is used exactly once for validation. This method is also less computationally expensive than k-fold cross-validation, as it only requires training n models. However, leave-one-out cross-validation can have a high variance, as the training sets are almost identical for each model. This can lead to overfitting, where the model performs well on the training data but poorly on new data. Leave-one-out cross-validation can also be sensitive to outliers, as removing a single observation can have a large impact on the model’s performance. Accelerate Your Career in AI with Best Machine Learning Courses When to use K-fold Cross Validation vs Leave one out The choice between k-fold cross-validation and leave-one-out cross-validation depends on several factors, including the size of the dataset, the complexity of the model, and the desired level of accuracy. In general, k-fold cross-validation is preferred for larger datasets, as it provides more efficient use of data and is less sensitive to outliers. It is also useful for models with a large number of parameters, as it can help identify the optimal values for these parameters. Leave-one-out cross-validation, on the other hand, is preferred for smaller datasets, as it provides an unbiased estimate of the prediction error and is less computationally expensive. It is also useful for models with a small number of parameters, as it can help identify the optimal values for these parameters. Real-world Applications Cross-validation Cross-validation is a widely used technique in machine learning and data science, with applications in a variety of fields, including healthcare, finance, and marketing. Accelerate Your Career in AI with Best Machine Learning Courses Conclusion k-fold cross-validation and leave-one-out cross-validation are two popular methods for estimating the prediction error of a model. K-fold cross-validation is preferred for larger datasets and models with a large number of parameters, while leave-one-out cross-validation is preferred for smaller datasets and models with a small number of parameters. Both methods have their advantages and disadvantages, and the choice between them depends on several factors, including the size of the dataset, the complexity of the model, and the desired level of accuracy. By using cross-validation, data scientists and machine learning practitioners can develop more accurate and reliable predictive models, and avoid overfitting and underfitting. References
Best AI Annotation Tools: Revolutionizing Text Annotation
Text annotation is a crucial task in natural language processing (NLP) that involves labeling text data for training and validation. However, manual annotation is a time-consuming and expensive process that can suffer from inconsistencies and errors due to human limitations. To address these challenges, researchers have recently explored the potential of generative large language models (LLMs) to replace human annotators. In this article, we will explore the best AI annotation tools available and how they are revolutionizing the field. Best AI Annotation Tools AI annotation tools are software applications that use machine learning algorithms to help annotate data. These tools can be used to label images, videos, audio, and text data. They can also be used to generate training data for machine learning models. AI annotation tools can help improve the efficiency and quality of data labeling, making it easier to generate large datasets for AI models. There are many AI annotation tools currently available, but some stand out because of their ability to improve the efficiency and quality of data labeling. Here are some of the best AI annotation tools. Labelbox Labelbox is a data labeling platform that allows users to create, manage, and annotate datasets for machine learning models. It provides a user-friendly interface for annotators to label images, videos, and text data. Labelbox also offers features such as quality control, collaboration, and automation to help improve the efficiency and quality of data labeling. OpenAI’s GPT-4 API OpenAI’s GPT-4 API is one of the most popular AI annotation tools available. It is a generative LLM that can generate high-quality labels for a variety of NLP tasks. GPT-4 is trained on large amounts of text data and can be fine-tuned on specific tasks to improve its performance. It is also relatively affordable, with a cost of around $20 USD to annotate a dataset with 1,000 text samples. Hugging Face’s Transformers Hugging Face’s Transformers is another popular AI annotation tool that is built on top of PyTorch and TensorFlow. It offers a wide range of pre-trained models for various NLP tasks, including text classification, named entity recognition, and question answering. Transformers also allows users to fine-tune pre-trained models on their own datasets to improve their performance. Amazon SageMaker Ground Truth Amazon SageMaker Ground Truth is a fully managed data labeling service that uses machine learning to reduce the time and cost of manual annotation. It offers a variety of annotation workflows, including image classification, text classification, and named entity recognition. SageMaker Ground Truth also allows users to create custom annotation workflows and integrate them with their own machine-learning models. Prodigy Prodigy is a data annotation tool that is designed for machine learning practitioners. It offers a variety of annotation workflows, including text classification, named entity recognition, and image classification. Prodigy also allows users to create custom annotation workflows and to integrate with their own machine learning models. It is a paid tool, with a cost of $390 USD for a single user license. Labelbox Labelbox is a data annotation platform that offers a variety of annotation workflows, including text classification, named entity recognition, and image classification. It also offers collaboration features that allow multiple users to work on the same dataset. Labelbox is a paid tool, with a cost of $ 200 USD per month for a single-user license. Snorkel Snorkel is a data labeling and management platform that uses weak supervision to reduce the time and cost of manual annotation. It allows users to create labeling functions that generate labels based on patterns in the data, rather than relying on human annotators. Snorkel also offers a variety of annotation workflows, including text classification, named entity recognition, and image classification. Google Cloud AutoML Google Cloud AutoML is a suite of machine learning tools that includes a data labeling service. It offers a variety of annotation workflows, including text classification, named entity recognition, and image classification. AutoML also allows users to create custom machine learning models using their labeled data. SuperAnnotate SuperAnnotate is a data annotation platform that uses AI to help improve the efficiency and quality of data labeling. It provides a user-friendly interface for annotators to label images, videos, and text data. SuperAnnotate also offers features such as quality control, collaboration, and automation to help improve the efficiency and quality of data labeling. It uses AI to suggest annotations to annotators, which can help speed up the labeling process. Dataturks Dataturks is a data annotation platform that allows users to create, manage, and annotate datasets for machine learning models. It provides a user-friendly interface for annotators to label images, videos, and text data. Dataturks also offers features such as quality control, collaboration, and automation to help improve the efficiency and quality of data labeling. It uses AI to suggest annotations to annotators, which can help speed up the labeling process. Tpu vs Gpu: The Giants of Computational Power The Benefits of AI Annotation AI annotation offers several benefits over manual annotation. First, it is faster and more cost-effective, as LLMs can annotate large amounts of text data in a fraction of the time it would take human annotators. Second, it can improve the quality of labeled text data by reducing inconsistencies and errors caused by human limitations. Third, it can be used to annotate text data in languages that may not have enough human annotators available. The Future of AI Annotation AI annotation is still a relatively new field, and there is much research to be done to improve the performance of LLMs in text annotation. One area of research is developing LLMs that can generate labels for more complex NLP tasks, such as sentiment analysis and named entity recognition. Another area of research is developing LLMs that can generate labels for non-textual data, such as images and audio. Conclusion AI annotation tools are becoming increasingly important in various fields, including biology, computer vision, and natural language processing. They can help improve the efficiency and quality of data labeling, making it easier to generate large datasets for AI
Discovering Data: Best Websites For Datasets Copy

Data is the foundation of any data-driven decision process, be it in business intelligence, academic research, or machine learning applications. But finding relevant, high-quality data can be a challenge. Fortunately, numerous websites offer a vast array of datasets for a multitude of purposes. This article will guide you to some of the best sources of datasets, free and public, that you can leverage for your data projects. How Do You Get Good Websites For Datasets? A good dataset is not only about volume but also about relevance, quality, and integrity. It should be representative of the problem you’re trying to solve, have minimal missing values, and ideally be cleaned and formatted for ease of use. Here are some reliable sources: Kaggle Datasets Kaggle is a well-known platform for data science and machine learning enthusiasts. Its datasets section is a treasure trove of datasets spanning multiple domains. The community-driven nature of Kaggle ensures that the datasets are regularly updated and come with kernels (code snippets), which can serve as a starting point for your analysis. Google Public Datasets Google’s Public Datasets is a vast collection of datasets from various sectors, like environmental science, biology, and economics. These datasets are free and can be integrated directly with Google’s data analysis tools, such as Google Data Studio and Google BigQuery. Supervised Vs Unsupervised Machine Learning Free Datasets for Students UC Irvine’s Machine Learning Repository is an excellent resource, especially for students. It offers hundreds of datasets perfect for machine learning projects. Data.gov is another resource where students can access free datasets on a wide variety of topics. GitHub Datasets GitHub, primarily known as a code hosting platform, also hosts a large number of datasets. Data repositories like ‘Awesome Public Datasets’ on GitHub curate a vast collection of datasets from various domains, all ready for use. What is a Website Dataset? A website dataset refers to a collection of data that’s available on a website for download and use. These datasets come in various formats such as CSV, JSON, or directly in a database, and cover numerous topics, making them ideal for different projects and analyses. Are Google Datasets Free? Yes, Google provides a host of datasets for free through its Google Public Datasets program. These datasets are perfect for researchers, data scientists, and anyone interested in analyzing data related to various sectors. What are Interesting Datasets? The definition of ‘interesting’ varies depending on your interests or the problem you are trying to solve. However, datasets like the World Development Indicators from the World Bank, the Human Genome Project, or the Netflix Prize dataset are often deemed interesting due to their complexity and the rich insights they offer. Precision vs Accuracy Machine Learning: A Detailed Examination Free Datasets There are many websites offering free datasets, such as the U.S. Census Bureau, which provides demographic, economic, and geographic data. The European Union Open Data Portal offers data from various institutions within the European Union. Data Sets to Analyze for Projects When it comes to finding datasets for projects, consider what you want to achieve with your analysis. For machine learning projects, MNIST (handwritten digits) or CIFAR-10 (object recognition) are good starting points. For statistics or data visualization, consider using the Titanic dataset on Kaggle or the Gapminder dataset. In conclusion, finding the right dataset is crucial in the realm of data analysis. Whether you’re a data science novice, a researcher, or a seasoned data scientist, the aforementioned platforms offer a multitude of high-quality datasets that can cater to your specific needs. So, happy data hunting, and may your insights be rich and your conclusions insightful! FAQs 1. Where can I find good datasets for my project? There are many platforms where you can find good datasets for your project, such as Kaggle, Google Public Datasets, UC Irvine’s Machine Learning Repository, Data.gov, and GitHub, among others. 2. What is a website dataset? A website dataset refers to a collection of data that is available on a website for download and use. These datasets can cover a wide variety of topics and can come in various formats such as CSV, JSON, or SQL. 3. Are all datasets on Google’s Public Datasets platform free? Yes, all datasets available on Google’s Public Datasets platform are free to use. They cover various sectors and can be integrated directly with Google’s data analysis tools for easier use. 4. Where can students find free datasets? UC Irvine’s Machine Learning Repository and Data.gov are excellent platforms where students can find free datasets for their projects. Additionally, platforms like Kaggle and GitHub also host a wide variety of datasets that can be used. 5. What makes a dataset “interesting”? An “interesting” dataset often refers to data that offers rich insights, poses challenging questions, or covers a complex or novel area of study. What’s considered interesting can vary widely depending on the specific field of study or the individual researcher’s interests. 6. Are there any free datasets available for use? Yes, many platforms offer free datasets. These include Google Public Datasets, Kaggle, UC Irvine’s Machine Learning Repository, Data.gov, GitHub, the U.S. Census Bureau, and the European Union Open Data Portal, among others. 7. How do I choose a dataset to analyze for my project? The choice of dataset depends on your project’s objectives. If your goal is to develop a machine learning model, you might choose a dataset like MNIST or CIFAR-10. If you’re looking to practice data visualization or statistical analysis, you might choose a dataset like the Titanic dataset on Kaggle or the Gapminder dataset. 8. Can I use these datasets for commercial purposes? While many datasets are freely available, their use for commercial purposes will depend on the specific terms and conditions set by the provider. It’s essential to review these terms before using the dataset for commercial purposes. References