
State-of-the-Art Object Detection with YOLO
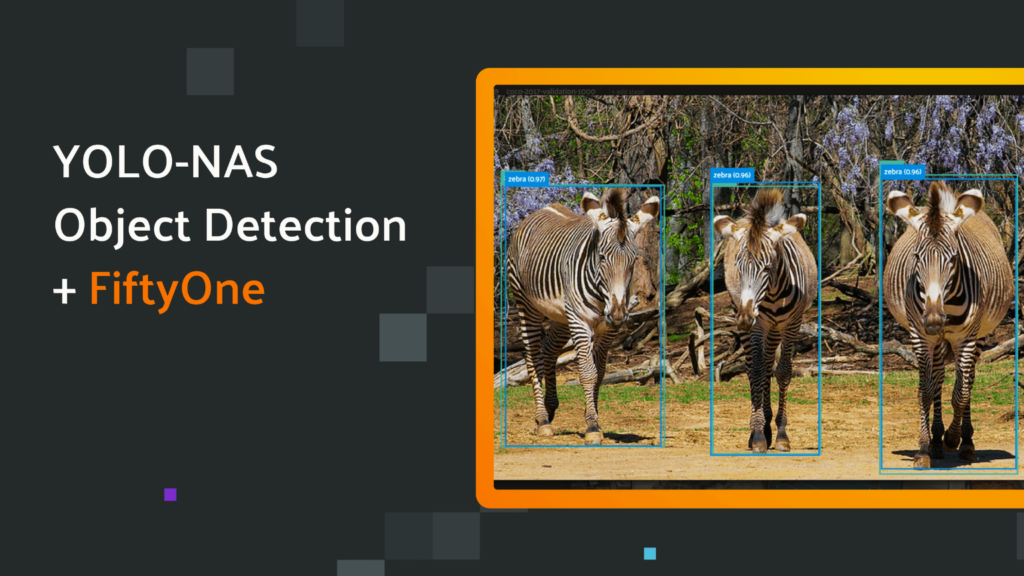
Object detection is a crucial task in computer vision that involves identifying and localizing objects within an image or video. Over the years, there has been a significant increase in research on object detection techniques such as object classification, counting of objects, and object monitoring. In this article, we will focus on the state-of-the-art object detection with YOLO (You Only Look Once), and how it has revolutionized object detection. Electric Vehicles Vs Fuel Vehicles: A Comparative Study Object Detection Object detection is a fundamental task in computer vision that involves identifying and localizing objects within an image or video. It has gained much attention over the years due to its numerous applications in various fields, such as autonomous driving, surveillance, and robotics. Object detection involves two main tasks: object localization and object classification. Object localization involves identifying the location of an object within an image, while object classification involves identifying the type of object. Traditional Object Detection Techniques Traditional object detection techniques involve a two-stage process that includes region proposal and object classification. The region proposal generates a set of candidate regions that may contain objects, while the object classification stage classifies the objects within the candidate regions. These techniques are computationally expensive and require a lot of memory, making them unsuitable for real-time applications. State-of-the-Art Object Detection with YOLO YOLO-NAS is a next-generation object detection model generated by Deci’s Neural Architecture Search Technology, AutoNAC™. It delivers state-of-the-art (SOTA) performance with unparalleled accuracy-speed performance, outperforming other models such as YOLOv5, YOLOv6, YOLOv7, and YOLOv8. State-of-the-art object detection techniques have been developed to overcome the limitations of traditional techniques. One such technique is You Only Look Once (YOLO), which is a real-time object detection system that can detect objects in an image or video in a single pass. YOLO uses a single neural network to predict the bounding boxes and class probabilities for the objects within an image. This makes it faster and more accurate than traditional techniques. Superior Real-Time Object Detection Capabilities YOLO-NAS provides superior real-time object detection capabilities and production-ready performance. It is a game-changer in the world of object detection, providing AI teams with tools to remove development barriers and attain efficient inference performance more quickly. Proprietary Neural Architecture Search Technology Deci’s proprietary Neural Architecture Search technology, AutoNAC™, generated the YOLO-NAS model. AutoNAC™ is a powerful tool that automates the process of designing neural network architectures. It uses a combination of reinforcement learning and evolutionary algorithms to search for the optimal architecture for a given task. This approach allows for the creation of highly efficient and effective models that outperform traditional hand-designed models. Open-source license and Pre-Trained Weights The YOLO-NAS model is available under an open-source license with pre-trained weights available for non-commercial use on SuperGradients, Deci’s PyTorch-based, open-source, computer vision training library. With SuperGradients, users can train models from scratch or fine-tune existing ones, leveraging advanced built-in training techniques like Distributed Data-Parallel, Exponential Moving Average, Automatic mixed precision, and Quantization Aware Training. Potential Use Cases YOLO-NAS has potential use cases in various industries, including retail and security. In retail, it can be used for object detection in inventory management, product placement, and customer behavior analysis. In security, it can be used for surveillance, crowd monitoring, and facial recognition. YOLO Architecture The YOLO architecture consists of a convolutional neural network (CNN) that takes an input image and outputs a set of bounding boxes and class probabilities for the objects within the image. The CNN is divided into two parts: the feature extraction part and the detection part. The feature extraction part is responsible for extracting features from the input image, while the detection part is responsible for predicting the bounding boxes and class probabilities for the objects within the image.HDFS vs S3: Understanding the Differences, Advantages, and Use Cases Harnessing YOLO: From Setup to Real-time Object Detection Installing Darknet (YOLO framework) Downloading Pre-trained Weights To quickly start detecting objects on images, you can download YOLO’s pre-trained weights. Object Detection on an Image: Once you’ve got the weights, use the following to detect objects on an image: Displaying Detection Results After running the detection, an image named ‘predictions.jpg’ will be saved. You can view this using any image viewer or in Python as: Training YOLO on Custom Data To train YOLO on custom data, you need to have your data in YOLO format and modify the configuration files accordingly. Here’s a simple training command: Real-time Detection on a Webcam You can also use YOLO for real-time object detection on a webcam feed: Note: The -c 0 argument specifies that the first camera device should be used. Tuning Detection Threshold If you’re getting too many false positives or missing objects, you might want to adjust the detection threshold: YOLO Training Training YOLO involves feeding the CNN with a large dataset of labeled images. The CNN learns to predict the bounding boxes and class probabilities for the objects within the images by minimizing the loss function. The loss function measures the difference between the predicted bounding boxes and class probabilities and the ground truth bounding boxes and class probabilities. YOLO Performance YOLO has been shown to outperform traditional object detection techniques in terms of speed and accuracy. YOLO can detect objects in real-time, making it suitable for applications that require fast object detection. YOLO also has a high accuracy rate, with an average precision of 63.4% on the PASCAL VOC 2012 dataset. YOLO Variants Several variants of YOLO have been developed to improve its performance. YOLOv2, for example, uses a more complex network architecture and data augmentation techniques to improve its accuracy. YOLOv3 uses a feature pyramid network to detect objects at different scales, while YOLOv4 uses a more efficient backbone network and data augmentation techniques to improve its accuracy. Challenges and Future Directions Despite its success, YOLO still faces several challenges. One of the main challenges is detecting small objects, as YOLO struggles to detect objects that are smaller than the grid size. Another challenge is detecting objects in
Vector Search in Computer Vision: Enhancing Search Experience with High-Dimensional Vectors
In today’s digital age, we are generating more data than ever before. With the rise of big data, traditional keyword-based search engines are no longer sufficient to deliver accurate and relevant results. Enter vector search, a new approach to search that uses high-dimensional vectors to represent data and related context. In this article, we will explore how vector search can be applied to computer vision, a field that deals with the analysis and interpretation of visual data. What is a Vector Search? Vector search is a search technique that uses high-dimensional vectors to represent data and related context. These vectors are generated by models that are trained on millions of examples to deliver more relevant and accurate results. At the core of a vector search engine is the idea that if data and documents are alike, their vectors will be similar. By indexing both queries and documents with vector embeddings, you can find similar documents as the nearest neighbors of your query. Vector search is not limited to text data. You can create embeddings for text, images, audio, or sensor measurements. This makes vector search a versatile tool for a wide range of applications, including computer vision. What is Computer Vision? Computer vision is a field that deals with the analysis and interpretation of visual data. It involves the use of algorithms and mathematical models to extract meaningful information from images and videos. Computer vision has a wide range of applications, including object recognition, image segmentation, face detection, and autonomous vehicles. Difference Between Statistics and Machine Learning How can Vector Search be Applied to Computer Vision? Vector search can be applied to computer vision in several ways. One of the most common applications is image similarity search. Image similarity search involves finding images that are similar to a given query image. This can be useful in a wide range of applications, including e-commerce, social media, and healthcare. To perform image similarity search, you first need to generate vector embeddings for your images. This can be done using deep learning models such as convolutional neural networks (CNNs). Once you have generated the embeddings, you can use vector search algorithms such as approximate nearest neighbor (ANN) search to find images that are similar to your query image. Another application of vector search in computer vision is object recognition. Object recognition involves identifying objects in images and videos. This can be useful in applications such as surveillance, autonomous vehicles, and robotics. To perform object recognition using vector search, you first need to generate vector embeddings for your objects. This can be done using CNNs or other deep learning models. Once you have generated the embeddings, you can use vector search algorithms to find objects that are similar to your query object. This can be useful in scenarios where you need to quickly identify objects in images or videos. Electric Vehicles Vs Fuel Vehicles: A Comparative Study Benefits of Vector Search in Computer Vision Vector search offers several benefits when applied to computer vision. One of the main benefits is improved accuracy. By using high-dimensional vectors to represent data and related context, vector search can deliver more accurate and relevant results than traditional keyword-based search engines. Another benefit of vector search in computer vision is speed. Vector search algorithms are designed to work with high-dimensional data, which means they can process large amounts of data quickly and efficiently. This makes vector search a useful tool for applications that require real-time processing, such as autonomous vehicles and robotics. Vector search also offers the ability to search beyond text data. By creating embeddings for images and other types of data, vector search can be used to search a wide range of data types. This makes vector search a versatile tool for a wide range of applications, including computer vision. Challenges of Vector Search in Computer Vision While vector search offers several benefits when applied to computer vision, there are also some challenges to consider. One of the main challenges is the need for large amounts of training data. To generate accurate vector embeddings, you need to train your models on millions of examples. This can be time-consuming and resource-intensive. Another challenge of vector search in computer vision is the need for specialized hardware. Vector search algorithms require specialized hardware such as GPUs to process high-dimensional data quickly and efficiently. This can be a barrier to entry for some organizations that do not have access to specialized hardware. Conclusion Vector search is a powerful tool for enhancing search experience in computer vision. By using high-dimensional vectors to represent data and related context, vector search can deliver more accurate and relevant results than traditional keyword-based search engines. Vector search can be applied to a wide range of applications in computer vision, including image similarity search and object recognition. While there are some challenges to consider, the benefits of vector search in computer vision make it a valuable tool for organizations looking to extract meaningful insights from visual data. References
What is ControlNet? A Comprehensive Guide to Adding Conditional Control to Text-to-Image Diffusion Models

If you’re interested in image synthesis, you may have heard of ControlNet. This innovative technology allows for the creation of high-quality images with greater control and precision than ever before. In this article, we’ll explore what ControlNet is, how it works, and why it’s such an exciting development in the field of image synthesis.When AI Attracts Attention: Dall E Mini Too Much Traffic What is ControlNet? ControlNet is an implementation of Adding Conditional Control to Text-to-Image Diffusion Models. This technology allows for the creation of high-quality images by using text descriptions as input. The system is designed to generate images that match the input text as closely as possible while also allowing for a high degree of control over the final output. How does ControlNet work? ControlNet works by using a diffusion model to generate images. The diffusion model is a type of generative model that uses a series of transformations to generate images. These transformations are applied in a random order, which allows for a high degree of variation in the final output. Diffusion Model The diffusion model is a type of generative model that uses a series of transformations to generate images. These transformations are applied in a random order, which allows for a high degree of variation in the final output. In ControlNet, the diffusion model is conditioned on the text descriptions, which means that the system generates images that match the input text as closely as possible. Composable Conditions One of the key features of ControlNet is its ability to provide fine-grained control over the generated images. This is achieved by using a technique called “composable conditions.” Composable conditions are a set of binary variables that control different aspects of the generated images. For example, one condition might control the color of the generated image, while another condition might control the shape of the objects in the image. Diffusion-Based Data Augmentation Another important feature of ControlNet is its ability to prevent distortion when training with small datasets. This is achieved by using a technique called “diffusion-based data augmentation.” Diffusion-based data augmentation involves adding noise to the input text descriptions, which helps to prevent overfitting and improve the quality of the generated images. Why is ControlNet important? ControlNet is an important development in the field of image synthesis because it allows for a high degree of control over the final output. This is particularly useful in applications where precise control over the generated images is important, such as in the creation of medical images or in the design of products. ControlNet also has the potential to be used in a wide range of applications, from video game design to virtual reality. By allowing for the creation of high-quality images with greater control and precision, ControlNet has the potential to revolutionize the way we create and interact with digital media. ControlNet has several practical applications. For example, it can be used in the design of products, such as furniture or clothing. By allowing designers to generate images of their products before they are manufactured, ControlNet can help to reduce the time and cost of the design process. ControlNet also has the potential to be used in video game design and virtual reality. By allowing for the creation of high-quality images with greater control and precision, ControlNet can help to create more immersive and realistic virtual environments. Difference Between Statistics and Machine Learning Conclusion ControlNet is an exciting development in the field of image synthesis. Its technical features, such as composable conditions and diffusion-based data augmentation, make it a powerful tool for generating high-quality images with fine-grained control. Its practical applications in product design, medical imaging, and virtual reality make it a versatile technology with the potential to transform a wide range of industries. As researchers continue to explore the possibilities of ControlNet, we can expect to see even more innovative applications in the future.
Amazon’s ARMBench Dataset: A Comprehensive Solution for Robotic Manipulation in Warehouses
Robotic systems for object handling in warehouses can expedite fulfillment of customer orders by automating tasks such as object picking, sorting, and packing. However, building reliable and scalable robotic systems for object manipulation in warehouses is not trivial. Modern warehouses process millions of unique objects with diverse shapes, materials, and other physical properties. These objects are often stored in unstructured configurations within containers which pose challenges for robotic perception and planning. From 2015 to 2017, the Amazon Robotics Challenge (ARC) helped push the state-of-the-art for robotic systems in a pick-and-place task representative of a warehouse. In this article, we will explore Amazon’s ARMBench dataset, a large-scale, object-centric benchmark dataset for robotic manipulation in the context of a warehouse.The Emergence of Get Paid to Do Tasks Copy ARMBench Dataset Overview ARMBench contains images, videos, and metadata that corresponds to 235K+ pick-and-place activities on 190K+ unique objects. The data is captured at different stages of manipulation, i.e., pre-pick, during transfer, and after placement. Benchmark tasks are proposed by virtue of high-quality annotations and baseline performance evaluation are presented on three visual perception challenges, namely 1) object segmentation in clutter, 2) object identification, and 3) defect detection. ARMBench can be accessed at http://armbench.com. Data Collection The ARMBench dataset was collected in an Amazon warehouse using a robotic manipulator performing object singulation from containers with heterogeneous contents. The dataset captures diversity in objects with respect to Amazon product categories as well as physical characteristics such as size, shape, material, deformability, appearance, fragility, etc. The dataset presents a collection of sensor data acquired by a robotic manipulation workcell performing pick-and-place operation, metadata and reference images for objects in containers, a set of annotations acquired either automatically, by virtue of the system design, or via manual labeling, and tasks and metrics to benchmark perception algorithms for robotic manipulation. Benchmark Tasks and Annotation Statistics The ARMBench dataset presents a variety of benchmark tasks and annotation statistics. The left side of Fig. 2 illustrates the benchmark tasks and annotation statistics on the ARMBench dataset. The right side of Fig. 2 shows the distribution of product-groups and object dimensions for 190,00+ unique objects in the dataset. The dataset captures diversity in objects with respect to Amazon product categories as well as physical characteristics such as size, shape, material, deformability, appearance, fragility, etc. The benchmark tasks proposed in ARMBench are object segmentation, object identification, and defect detection. Object segmentation is the task of identifying the pixels that belong to an object in an image. Object identification is the task of recognizing the object category and instance from an image. Defect detection is the task of identifying defects in objects such as cracks, dents, or deformations. The annotations for these tasks are provided in the form of pixel-level segmentation masks, object category labels, and defect labels, respectively. The dataset also provides metrics to evaluate the performance of algorithms on these tasks, such as mean intersection over union (mIoU) for segmentation, top-1 accuracy for identification, and precision-recall curves for defect detection. Baseline Performance Evaluation ARMBench provides baseline performance evaluation for the benchmark tasks on a set of state-of-the-art algorithms. The evaluation is performed on a held-out test set of 10,000 images. The results show that the proposed benchmark tasks are challenging and require further research to achieve high performance. For example, the best-performing algorithm achieves an mIoU of 0.44 on the object segmentation task, which is significantly lower than the state-of-the-art performance on other datasets such as COCO and PASCAL VOC. Similarly, the top-1 accuracy for object identification is 0.54, which is lower than the performance on other datasets such as ImageNet. These results highlight the need for developing algorithms that can generalize to a wide variety of objects and configurations in warehouse environments. When AI Attracts Attention: Dall E Mini Too Much Traffic Conclusion Amazon’s ARMBench dataset is a comprehensive solution for robotic manipulation in warehouses. The dataset captures the diversity of objects and configurations in warehouse environments and provides benchmark tasks and annotations for evaluating visual perception algorithms. The baseline performance evaluation shows that the proposed benchmark tasks are challenging and require further research to achieve high performance. ARMBench is a valuable resource for researchers and practitioners working on robotic systems for object manipulation in warehouses. References
AI Data Visualization Tools: Enhancing Data Analysis and Decision Making
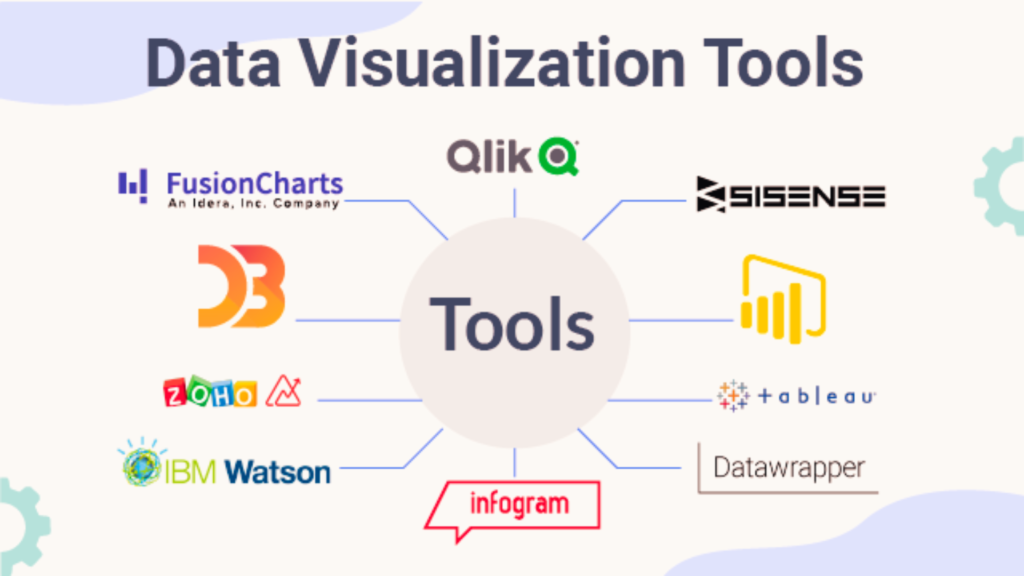
Data visualization is an essential tool for understanding complex data sets. It allows us to see patterns, trends, and relationships that might not be apparent in raw data. However, creating effective visualizations can be a time-consuming and challenging task. This is where artificial intelligence (AI) comes in. AI data visualization tools can help automate the process of creating visualizations, making it easier and faster to gain insights from data. In this article, we will explore the benefits of AI data visualization tools and some of the latest advances in this field.Managing Large Data Sets: Navigating the Ocean of Information What are AI Data Visualization Tools? AI data visualization tools use machine learning algorithms to analyze data and create visualizations automatically. These tools can take raw data and turn it into charts, graphs, and other visualizations that are easy to understand. They can also help identify patterns and trends in data that might not be apparent to the human eye. One of the key benefits of AI data visualization tools is that they can save time and reduce the workload of data analysts. Instead of spending hours creating visualizations manually, analysts can use AI tools to generate visualizations quickly and easily. This allows them to focus on analyzing the data and gaining insights, rather than spending time on repetitive tasks. Types of AI Data Visualization Tools There are several types of AI data visualization tools available, each with its own strengths and weaknesses. Some of the most common types include: Automated Visualization Tools These tools use machine learning algorithms to analyze data and create visualizations automatically. They can generate a wide range of visualizations, including charts, graphs, and heat maps. Natural Language Processing (NLP) Tools These tools use NLP algorithms to analyze text data and create visualizations based on the content of the text. They can be used to create word clouds, sentiment analysis charts, and other types of visualizations. Augmented Reality (AR) Tools These tools use AR technology to create interactive visualizations that can be viewed in 3D. They are particularly useful for visualizing complex data sets, such as medical images or engineering models. Benefits of AI Data Visualization Tools AI data visualization tools offer several benefits over traditional manual methods. Some of the key benefits include: The Emergence of Get Paid to Do Tasks Copy Latest Advances in AI Data Visualization Tools The field of AI data visualization is rapidly evolving, with new tools and techniques being developed all the time. Some of the latest advances in this field include: Generative Adversarial Networks (GANs): GANs are a type of machine learning algorithm that can generate new data based on existing data. They can be used to create new visualizations based on existing data sets, allowing analysts to explore data in new ways. Explainable AI (XAI): XAI is a field of AI that focuses on making AI algorithms more transparent and understandable. This can be particularly useful in data visualization, where it is important to understand how visualizations are generated. Interactive Visualization Tools: Interactive visualization tools allow users to explore data in real-time, making it easier to identify patterns and trends. These tools can be particularly useful for collaborative data analysis. Cloud-Based Visualization Tools: Cloud-based visualization tools allow users to access data and visualizations from anywhere, making it easier to collaborate on data analysis projects. Top 5 Data Visualization Tools Below are the top 5 AI-powered data visualization tools that have proven to be effective across various sectors: Tableau: As mentioned earlier, Tableau is known for its intuitive interface and powerful AI-driven analytics capabilities. Microsoft Power BI: Power BI shines in its ability to integrate with other Microsoft products. This ability makes it ideal for businesses already using Microsoft tools. Qlik Sense: Qlik Sense stands out for its associative model. This model allows users to probe all potential associations in their data, rather than being limited by pre-defined queries. IBM Watson Analytics: Watson Analytics brings AI’s power to business analytics. It offers automatic data preparation, predictive analysis, and effortless dashboard creation. TIBCO Spotfire: Spotfire provides an immersive, smart, and fast analytics experience, from data prep to advanced predictive and real-time analytics. Conclusion AI data visualization tools are transforming the way we analyze and understand data. They offer faster insights, improved accuracy, and increased efficiency, making it easier to gain insights from complex data sets. With the latest advances in AI technology, we can expect to see even more powerful and innovative data visualization tools in the future. As data becomes increasingly important in decision making, AI data visualization tools will play an increasingly important role in helping us make sense of the world around us. References
Preparing Large Image Datasets: A Step-by-Step Guide

Image classification is a popular application of machine learning that involves training a model to recognize and categorize images based on their visual features. However, one of the biggest challenges in image classification is preparing a large dataset of images that can be used to train and test the model. In this article, we will provide a step-by-step guide on preparing large image datasets for image classification. Preparing Large Image Datasets Step 1: Collecting Images The first step in preparing a large image dataset is to collect images that are relevant to the problem you are trying to solve. For example, if you are building an image classifier for different types of fruits, you would need to collect images of different fruits such as apples, bananas, oranges, and so on. There are several ways to collect images, including: – Downloading images from the internet: There are several websites that provide free images that can be used for non-commercial purposes. Some popular websites include Unsplash, Pexels, and Pixabay. – Capturing images using a camera: If you have access to a camera, you can capture images of objects that are relevant to your problem. –Using pre-existing datasets: There are several pre-existing datasets that can be used for image classification, such as the CIFAR-10 and CIFAR-100 datasets. Choosing the Right Image Format When collecting images for your dataset, it is important to choose the right image format. The most common image formats are JPEG, PNG, and BMP. JPEG is a compressed format that is suitable for photographs, while PNG is a lossless format that is suitable for images with transparent backgrounds. BMP is an uncompressed format that is suitable for images with simple color schemes. Choosing the right image format can help to reduce the size of the dataset and improve the performance of the model. Best Algorithms for Face Recognition Step 2: Preprocessing Images Once you have collected a large number of images, the next step is to preprocess them so that they can be used for training and testing the model. Preprocessing involves several steps, including: – Resizing images: Images may be of different sizes, so it is important to resize them to a uniform size so that they can be fed into the model. A common size for images is 224×224 pixels. – Normalizing pixel values: Pixel values in images range from 0 to 255, so it is important to normalize them to a range of 0 to 1 so that they can be processed by the model. – Splitting images into training and testing sets: It is important to split the dataset into training and testing sets so that the model can be trained on one set and tested on another set. Labeling Images Labeling images involves assigning a category or class to each image in the dataset. This is an important step in image classification, as it allows the model to learn the relationship between the visual features of the image and its corresponding label. There are several tools that can be used for labeling images, such as LabelImg and RectLabel. Step 3: Augmenting Images Augmenting images involves creating new images from the existing dataset by applying transformations such as rotation, flipping, and zooming. Augmenting images can help to increase the size of the dataset and improve the performance of the model. There are several libraries that can be used for image augmentation such as Keras ImageDataGenerator and OpenCV. Step 4: Building the Model Once the dataset has been prepared, the next step is to build the model. There are several pre-trained models that can be used for image classification, such as VGG-19, ResNet, and Inception. These models have already been trained on large datasets and can be fine-tuned for a specific problem by adding a few layers to the model. Step 5: Training and Testing the Model The final step is to train and test the model using the prepared dataset. The model is trained on the training set and tested on the testing set. The performance of the model is evaluated using metrics such as accuracy, precision, and recall. If the performance of the model is not satisfactory, the dataset can be further augmented or the model can be fine-tuned.The Emergence of Get Paid to Do Tasks Copy Conclusion Preparing a large image dataset for image classification can be a challenging task, but it is an important step in building an accurate and reliable model. In this article, we have provided a step-by-step guide on how to prepare a large image dataset for image classification. By following these steps, you can build a model that can accurately classify images and solve real-world problems. FAQs References
Managing Large Data Sets: Techniques and Approaches

In today’s digital age, data is being generated at an unprecedented rate. With the rise of the internet, social media, and the Internet of Things (IoT), the amount of data being produced is growing exponentially. This has led to the need for efficient and effective ways to manage large data sets. In this article, we will explore some of the techniques and approaches used for Managing Large Data Sets.What is Object Tracking in Computer Vision? A Detailed View Managing Large Data Sets The first step in managing large data sets is to understand what constitutes a large data set. A large data set is typically defined as a data set that is too large to be processed by traditional data processing techniques. This can be due to the size of the data set, the complexity of the data, or the speed at which the data is being generated. Approaches for Efficient Handling of Large Data Sets One of the biggest challenges in managing large data sets is the sheer size of the data. In most cases, the data to be processed does not fit into memory, which means that the high number of slow I/O operations will dominate the performance. There exist several methods for making data handling more efficient by compressing, partitioning, transforming the input data, suggesting more compact storage structures or increasing cache friendliness. Compression is a technique used to reduce the size of the data set. This can be done by removing redundant data or by using algorithms that compress the data. Compression can be used to reduce the amount of storage space required for the data set, which can help to reduce costs. Partitioning is another technique used to manage large data sets. Partitioning involves dividing the data set into smaller, more manageable parts. This can be done based on various criteria, such as time, location, or type of data. Partitioning can help to reduce the amount of data that needs to be processed at any given time, which can help to improve performance. Transforming the input data is another technique used to manage large data sets. This involves converting the data into a format that is more suitable for processing. For example, data can be transformed into a format that is more easily searchable or that can be processed more quickly. Increasing cache friendliness is another technique used to manage large data sets. This involves optimizing the data set so that it can be stored in cache memory. Cache memory is a type of memory that is faster than main memory, which means that data can be accessed more quickly. By optimizing the data set for cache memory, performance can be improved. Data Mining Techniques Data mining techniques are used to extract useful information from large data sets. Data mining involves analyzing data to identify patterns, relationships, and trends. There are several data mining techniques that can be used to manage large data sets, including: Clustering: Clustering is a technique used to group similar data points together. This can be useful for identifying patterns in the data and for identifying outliers. Classification: Classification is a technique used to categorize data into different classes or categories. This can be useful for predicting future trends or for identifying patterns in the data. Regression: Regression is a technique used to identify the relationship between two or more variables. This can be useful for predicting future trends or for identifying patterns in the data. Association Rule Mining: Association rule mining is a technique used to identify relationships between different variables in the data. This can be useful for identifying patterns in the data and for predicting future trends. Text Mining: Text mining is a technique used to extract useful information from unstructured text data. This can be useful for analyzing social media data or for analyzing customer feedback.Best Algorithms for Face Recognition Conclusion Managing large data sets is a complex task that requires a combination of techniques and approaches. By using compression, partitioning, transforming the input data, suggesting more compact storage structures or increasing cache friendliness, data can be processed more efficiently. Data mining techniques can also be used to extract useful information from large data sets. By understanding the different techniques and approaches used to manage large data sets, organizations can make better use of their data and gain valuable insights into their business operations. References