Data visualization is an essential tool for understanding complex data sets. It allows us to see patterns, trends, and relationships that might not be apparent in raw data. However, creating effective visualizations can be a time-consuming and challenging task. This is where artificial intelligence (AI) comes in. AI data visualization tools can help automate the process of creating visualizations, making it easier and faster to gain insights from data. In this article, we will explore the benefits of AI data visualization tools and some of the latest advances in this field.
Managing Large Data Sets: Navigating the Ocean of Information
What are AI Data Visualization Tools?
AI data visualization tools use machine learning algorithms to analyze data and create visualizations automatically. These tools can take raw data and turn it into charts, graphs, and other visualizations that are easy to understand. They can also help identify patterns and trends in data that might not be apparent to the human eye.
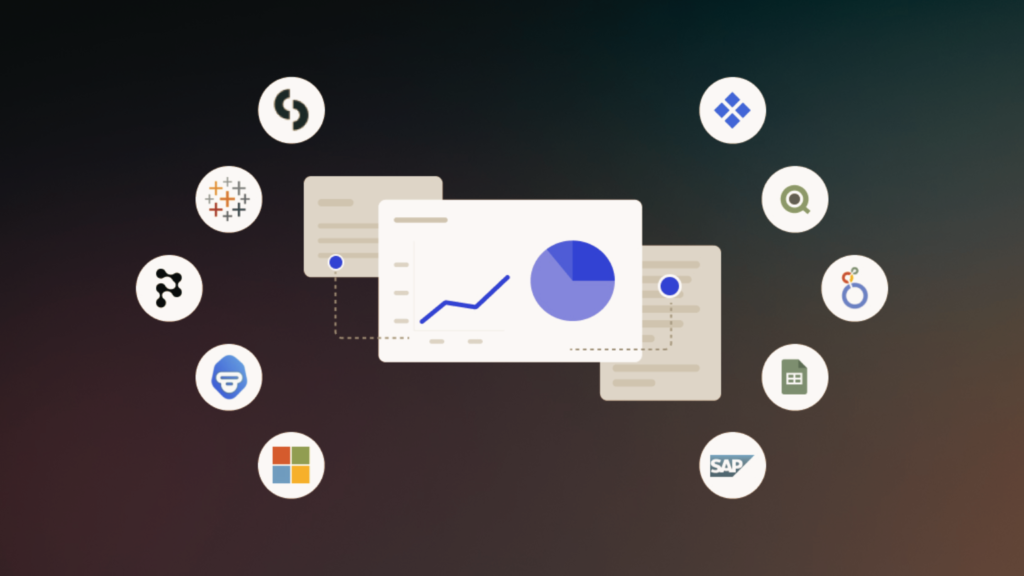
One of the key benefits of AI data visualization tools is that they can save time and reduce the workload of data analysts. Instead of spending hours creating visualizations manually, analysts can use AI tools to generate visualizations quickly and easily. This allows them to focus on analyzing the data and gaining insights, rather than spending time on repetitive tasks.
Types of AI Data Visualization Tools
There are several types of AI data visualization tools available, each with its own strengths and weaknesses. Some of the most common types include:
Automated Visualization Tools
These tools use machine learning algorithms to analyze data and create visualizations automatically. They can generate a wide range of visualizations, including charts, graphs, and heat maps.
Natural Language Processing (NLP) Tools
These tools use NLP algorithms to analyze text data and create visualizations based on the content of the text. They can be used to create word clouds, sentiment analysis charts, and other types of visualizations.
Augmented Reality (AR) Tools
These tools use AR technology to create interactive visualizations that can be viewed in 3D. They are particularly useful for visualizing complex data sets, such as medical images or engineering models.
Benefits of AI Data Visualization Tools
AI data visualization tools offer several benefits over traditional manual methods. Some of the key benefits include:
- Faster Insights: AI tools can generate visualizations quickly and easily, allowing analysts to gain insights from data more quickly.
- Improved Accuracy: AI tools can identify patterns and trends in data that might not be apparent to the human eye, improving the accuracy of data analysis.
- Increased Efficiency: AI tools can automate repetitive tasks, such as creating visualizations, freeing up analysts to focus on more complex tasks.
- Better Decision Making: AI tools can help identify patterns and trends in data that might not be apparent to the human eye, leading to better decision making.
- Scalability: AI tools can handle large data sets more easily than manual methods, making them ideal for big data applications.
The Emergence of Get Paid to Do Tasks Copy
Latest Advances in AI Data Visualization Tools
The field of AI data visualization is rapidly evolving, with new tools and techniques being developed all the time. Some of the latest advances in this field include:
Generative Adversarial Networks (GANs): GANs are a type of machine learning algorithm that can generate new data based on existing data. They can be used to create new visualizations based on existing data sets, allowing analysts to explore data in new ways.
Explainable AI (XAI): XAI is a field of AI that focuses on making AI algorithms more transparent and understandable. This can be particularly useful in data visualization, where it is important to understand how visualizations are generated.
Interactive Visualization Tools: Interactive visualization tools allow users to explore data in real-time, making it easier to identify patterns and trends. These tools can be particularly useful for collaborative data analysis.
Cloud-Based Visualization Tools: Cloud-based visualization tools allow users to access data and visualizations from anywhere, making it easier to collaborate on data analysis projects.
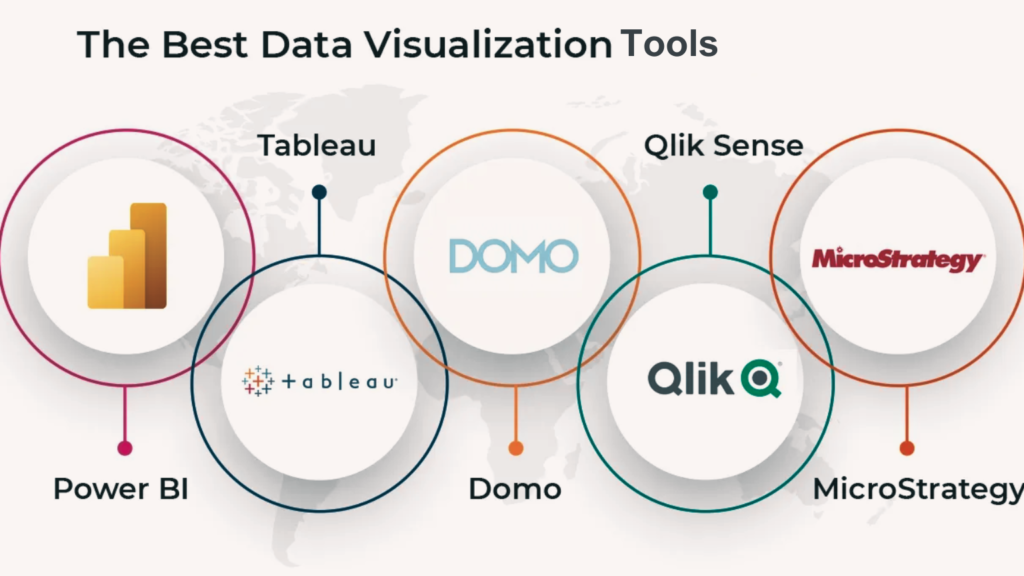
Top 5 Data Visualization Tools
Below are the top 5 AI-powered data visualization tools that have proven to be effective across various sectors:
Tableau: As mentioned earlier, Tableau is known for its intuitive interface and powerful AI-driven analytics capabilities.
Microsoft Power BI: Power BI shines in its ability to integrate with other Microsoft products. This ability makes it ideal for businesses already using Microsoft tools.
Qlik Sense: Qlik Sense stands out for its associative model. This model allows users to probe all potential associations in their data, rather than being limited by pre-defined queries.
IBM Watson Analytics: Watson Analytics brings AI’s power to business analytics. It offers automatic data preparation, predictive analysis, and effortless dashboard creation.
TIBCO Spotfire: Spotfire provides an immersive, smart, and fast analytics experience, from data prep to advanced predictive and real-time analytics.
Conclusion
AI data visualization tools are transforming the way we analyze and understand data. They offer faster insights, improved accuracy, and increased efficiency, making it easier to gain insights from complex data sets. With the latest advances in AI technology, we can expect to see even more powerful and innovative data visualization tools in the future. As data becomes increasingly important in decision making, AI data visualization tools will play an increasingly important role in helping us make sense of the world around us.


