Statistics is a crucial aspect of data analysis, and it is used to make sense of large amounts of data. There are two main types of statistics: Inferential Statistics vs Descriptive Statistics. In this article, we will explore the differences between these two types of statistics and their measurement techniques.
What is Descriptive Statistics?

Descriptive statistics is a technique used to describe and summarize data in a meaningful way. It is a simple technique that involves choosing a group of interest, recording data about the group, and then using summary statistics and graphs to describe the group properties. Descriptive statistics is used to describe the characteristics of a data set, and there is no uncertainty involved because you are just describing the people or items that you actually measure.
Measurement Techniques Used in Descriptive Statistics
There are several measurement techniques used in descriptive statistics, including:
- Measures of central tendency: These are measures that describe the central location of a data set. Examples include mean, median, and mode.
- Measures of variability: These are measures that describe the spread of a data set. Examples include range, variance, and standard deviation.
- Frequency distributions: This is a technique used to show how often each value in a data set occurs.
- Graphical representations: These are visual representations of data, such as histograms, scatter plots, and box plots.
What is Inferential Statistics?
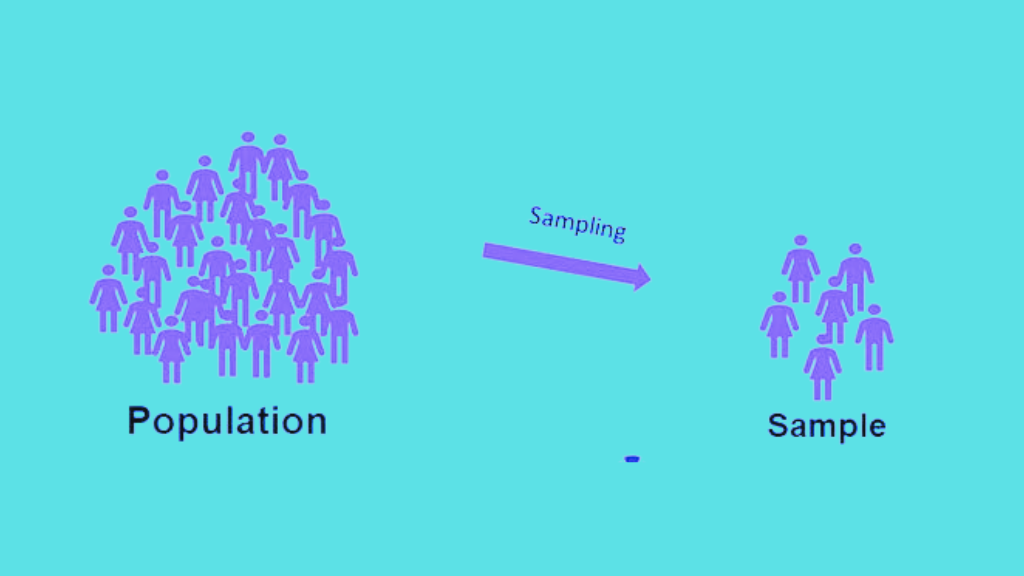
Inferential statistics is a technique used to draw conclusions or generalizations about a broader population using a sample of data. It involves using probability theory to make inferences about a population based on a sample. Inferential statistics is used when you want to know if there is a significant difference in the outcomes of patients who receive a drug compared to those who receive a placebo if you want to know if a new drug is effective.
Visual Studio Code vs Visual Studio
What is an example of an Inferential Statistic?
Let’s revisit the school scenario. Suppose the school wants to understand if a new teaching method has improved students’ performance. They could implement the method with a small group, then use inferential statistics to predict if the method would have a similar impact on the larger student body. This predictive capacity is a key aspect of inferential statistics.
What is Meant by Inferential Statistics?
Inferential statistics involves making predictions or drawing conclusions about a population based on observations and analyses of a sample. It uses methods such as hypothesis testing, regression analysis, and variance analysis to make predictions about unknown population parameters.
Measurement Techniques Used in Inferential Statistics
There are several measurement techniques used in inferential statistics, including:
- Hypothesis testing: This is a technique used to test a hypothesis about a population parameter using sample data.
- Confidence intervals: This is a range of values that is likely to contain the true population parameter with a certain level of confidence.
- Regression analysis: This is a technique used to model the relationship between two or more variables.
- Analysis of variance (ANOVA): This is a technique used to compare the means of two or more groups.

Keras vs PyTorch: An In-depth Comparison and Understanding
The Impact of Inferential Statistics vs Descriptive Statistics on Data Analytics
Descriptive and inferential statistics are both important in data analytics. Descriptive statistics is used to describe the characteristics of a data set, and it is useful in identifying patterns and trends in data. It is often used in exploratory data analysis to gain insights into the data before moving on to more complex analyses.
Descriptive statistics is also useful in summarizing data in a way that is easy to understand and communicate to others. Inferential statistics, on the other hand, is used to make predictions or generalizations about a population based on a sample of data. It is useful in hypothesis testing and in making decisions based on data. Inferential statistics is also used in predictive modeling, where the goal is to predict future outcomes based on past data.
Both descriptive and inferential statistics are important in data analytics because they help us make sense of large amounts of data. They are used to identify patterns and trends, make predictions, and make decisions based on data. Without these statistical techniques, it would be difficult to draw meaningful conclusions from data.
Conclusion
Descriptive and inferential statistics are two important statistical techniques used in data analytics. Descriptive statistics is used to describe and summarize data, while inferential statistics is used to make predictions or generalizations about a population based on a sample of data. Both techniques are important in data analytics because they help us make sense of large amounts of data and draw meaningful conclusions. By understanding the differences between these two techniques and their measurement techniques, we can use them effectively in our data analysis.


