
When conducting research studies, it is essential to collect and analyze data effectively to draw meaningful conclusions. Data can be broadly classified into two types: numerical and categorical. In this article, we will explore the differences between these two types of data and their importance in research studies.
Best Data Labeling Company in 2023
Numerical Data

Numerical data, also known as quantitative data, is data that can be measured and expressed in numbers. This type of data is continuous and can be further classified as discrete or continuous.
Discrete data is data that can only take on specific values, such as the number of people in a room.
Continuous data, on the other hand, can take on any value within a range, such as height or weight.
Numerical data is often analyzed using statistical methods such as mean, median, and mode. These methods help researchers to summarize and interpret the data effectively.
Categorical Data
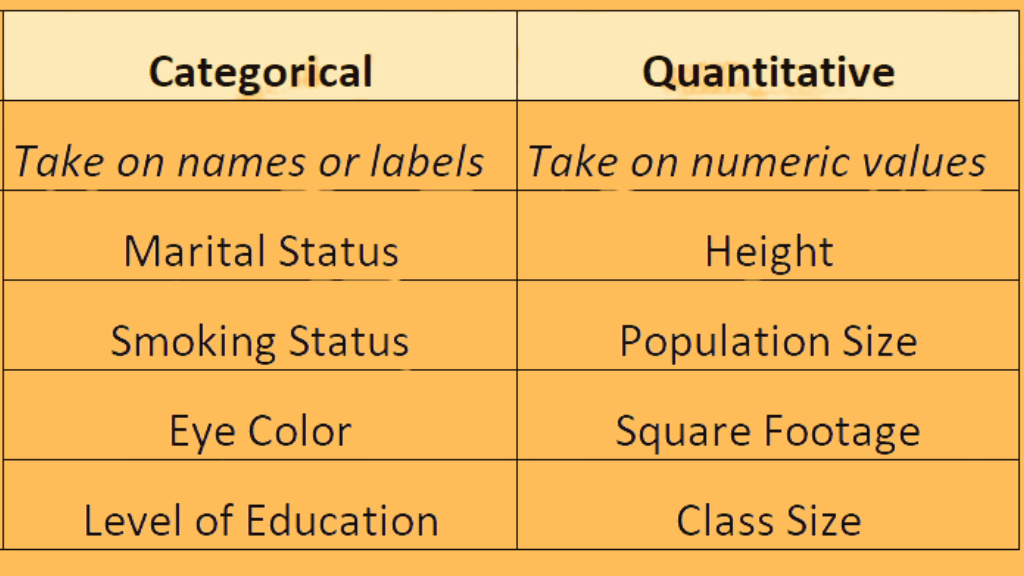
Categorical data, also known as qualitative data, is data that cannot be measured and expressed in numbers. This type of data is non-continuous and can be further classified as nominal or ordinal.
Nominal data is data that is expressed in categories, such as gender or race.
Ordinal data is data that can be arranged in a specific order, such as the level of education. Categorical data is often analyzed using frequency tables and charts. These methods help researchers to summarize and present the data effectively.
The Importance of Numerical vs Categorical Data in Research Studies
Both numerical and categorical data are essential in research studies.
Numerical data provides researchers with precise measurements and allows for statistical analysis. This type of data is often used in scientific studies, such as clinical trials, to measure the effectiveness of treatment. Categorical data, on the other hand, provides researchers with information about the characteristics of a population. This type of data is often used in social science studies, such as surveys, to understand the attitudes and behaviors of a group of people.
Collecting and Analyzing Numerical Data
When collecting numerical data, it is essential to ensure that the data is accurate and reliable. This can be achieved by using standardized measurement tools and ensuring that the data is collected consistently across all participants. Once the data is collected, it can be analyzed using statistical methods such as mean, median, and mode. These methods help researchers to summarize the data and draw meaningful conclusions. It is important to note that the choice of statistical method will depend on the type of data collected and the research question being addressed.
For example, if the research question is to determine the average height of a population, the mean would be an appropriate statistical method to use. However, if the data is skewed, the median may be a better measure of central tendency.
Collecting and Analyzing Categorical Data
When collecting categorical data, it is important to ensure that the categories are well-defined and mutually exclusive. This can be achieved by using standardized questionnaires or surveys. Once the data is collected, it can be analyzed using frequency tables and charts. These methods help researchers to summarize the data and identify patterns or trends.
For example, if the research question is to determine the prevalence of a certain disease in a population, a frequency table can be used to display the number of people with the disease and the number of people without the disease.
Visualizing Numerical and Categorical Data
Visualizing data is an effective way to communicate research findings to a wider audience. There are several ways to visualize numerical and categorical data, including histograms, scatter plots, bar charts, and pie charts. Histograms are used to display the distribution of numerical data. They show the frequency of data points within a specific range. Scatter plots are used to display the relationship between two numerical variables. They show how one variable changes in response to changes in the other variable. Bar charts and pie charts are used to display categorical data. Bar charts show the frequency of data points within each category. Pie charts show the proportion of data points within each category.
Conclusion
Numerical and categorical data are essential in research studies. Numerical data provides precise measurements and allows for statistical analysis, while categorical data provides information about the characteristics of a population. Collecting and analyzing data effectively is crucial to drawing meaningful conclusions from research studies. Visualizing data is an effective way to communicate research findings to a wider audience. By understanding the differences between numerical and categorical data, researchers can choose the appropriate methods to collect, analyze, and present their data.