Business Intelligence (BI) tools are essential for organizations that want to make data-driven decisions. Two of the most popular BI tools on the market today are Tableau and Power BI. In this article, we will compare Tableau vs Power BI and help you decide which one is right for your organization.
What is Tableau?

Tableau is a data visualization tool that allows users to create interactive dashboards and reports. It is known for its ease of use and intuitive drag-and-drop interface. Tableau can connect to a wide range of data sources, including spreadsheets, databases, and cloud services. It also has a large community of users who share tips and best practices.
What is Power BI?
Power BI is a cloud-based business analytics service that allows users to create interactive visualizations and reports. It is part of the Microsoft Power Platform and integrates with other Microsoft products such as Excel and SharePoint. Power BI can connect to a wide range of data sources, including cloud services, databases, and big data sources.
Tableau vs Power BI
Data Visualization
One of the most important features of any BI tool is its ability to create compelling visualizations. Tableau and Power BI both excel in this area, but they have different approaches.
Tableau is known for its beautiful and interactive visualizations. It has a wide range of chart types and customization options, allowing users to create stunning dashboards and reports. Tableau also has a large community of users who share their visualizations and best practices.
Power BI, on the other hand, is known for its simplicity and ease of use. It has a more limited range of chart types, but it makes up for this with its intuitive drag-and-drop interface. Power BI also has a large library of pre-built visualizations that users can customize to their needs.
Data Sources
Another important consideration when choosing a BI tool is its ability to connect to different data sources. Tableau and Power BI both have strong capabilities in this area.
Tableau can connect to a wide range of data sources, including spreadsheets, databases, and cloud services. It also has a large community of users who have created connectors for other data sources.
Power BI can also connect to a wide range of data sources, including cloud services, databases, and big data sources. It has a strong integration with other Microsoft products, such as Excel and SharePoint.
Ease of Use
Ease of use is another important consideration when choosing a BI tool. Tableau and Power BI both have intuitive interfaces, but they have different approaches.
Tableau is known for its ease of use and intuitive drag-and-drop interface. It has a simple and straightforward workflow that allows users to create visualizations quickly and easily. Tableau also has a large community of users who share tips and best practices, making it easy for new users to get started.
Power BI is also known for its ease of use, but it has a more structured workflow. It has a step-by-step process for creating visualizations, which can be helpful for users who are new to BI tools. Power BI also has a large library of pre-built visualizations that users can customize to their needs.
Pricing
Pricing is always an important consideration when choosing a BI tool. Tableau and Power BI have different pricing models.
Tableau offers both a desktop and a server version of its software. The desktop version starts at $70 per user per month, while the server version starts at $35 per user per month.
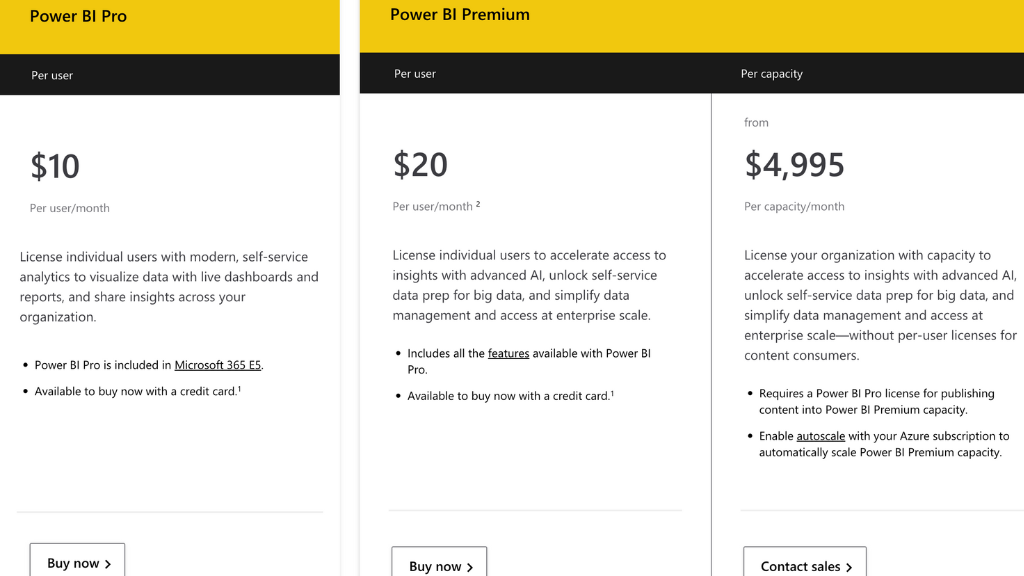
Power BI, on the other hand, is a cloud-based service that is priced on a per-user basis. It has a free version that allows users to create and share visualizations, but it has limited data storage and sharing capabilities. The paid version starts at $10 per user per month and includes more advanced features such as data modeling and collaboration.
Power Your Analytics with the Best Business Intelligence Dataset
Which BI Tool is Right for You?
Choosing the right BI tool depends on your organization’s needs and budget. If you are looking for a tool with a wide range of visualization options and a large community of users, Tableau may be the right choice for you. If you are looking for a tool that is easy to use and integrates well with other Microsoft products, Power BI may be the right choice for you. Ultimately, the best way to decide which BI tool is right for you is to try them both out. Both Tableau and Power BI offer free trials, so you can test them out and see which one works best for your organization.
Conclusion
Tableau and Power BI are both powerful BI tools that can help organizations make data-driven decisions. They have different strengths and weaknesses, so it is important to choose the one that best fits your organization’s needs and budget. By considering factors such as data visualization, data sources, ease of use, and pricing, you can make an informed decision and choose the BI tool that is right for you.
Accelerate Your Career in AI with Best Machine Learning Courses


